by: Drazen Lucanin (drazen.lucanin at gmail.com)
Eurostat is the statistical office of the European Union situated in Luxembourg. Its task is to provide the European Union with statistics at European level that enable comparisons between countries and regions.
An exact number of indicator isn't stated on the website, I would estimate around 180 of them. They are presented annually, but the some analyses of the data series' seem to update on the fly, as new information appears (which can be seen in the rss feed). Topics range from:
A good page to find the description of what is available through the Eurostat database and a sort of site map can be found here.
A wikipedia-style explanation of all the statistics can be found here.
Indicators (short-term, structural, theme-specific etc.) collected on the EU-27, the Eurozone, the member states and their partners.
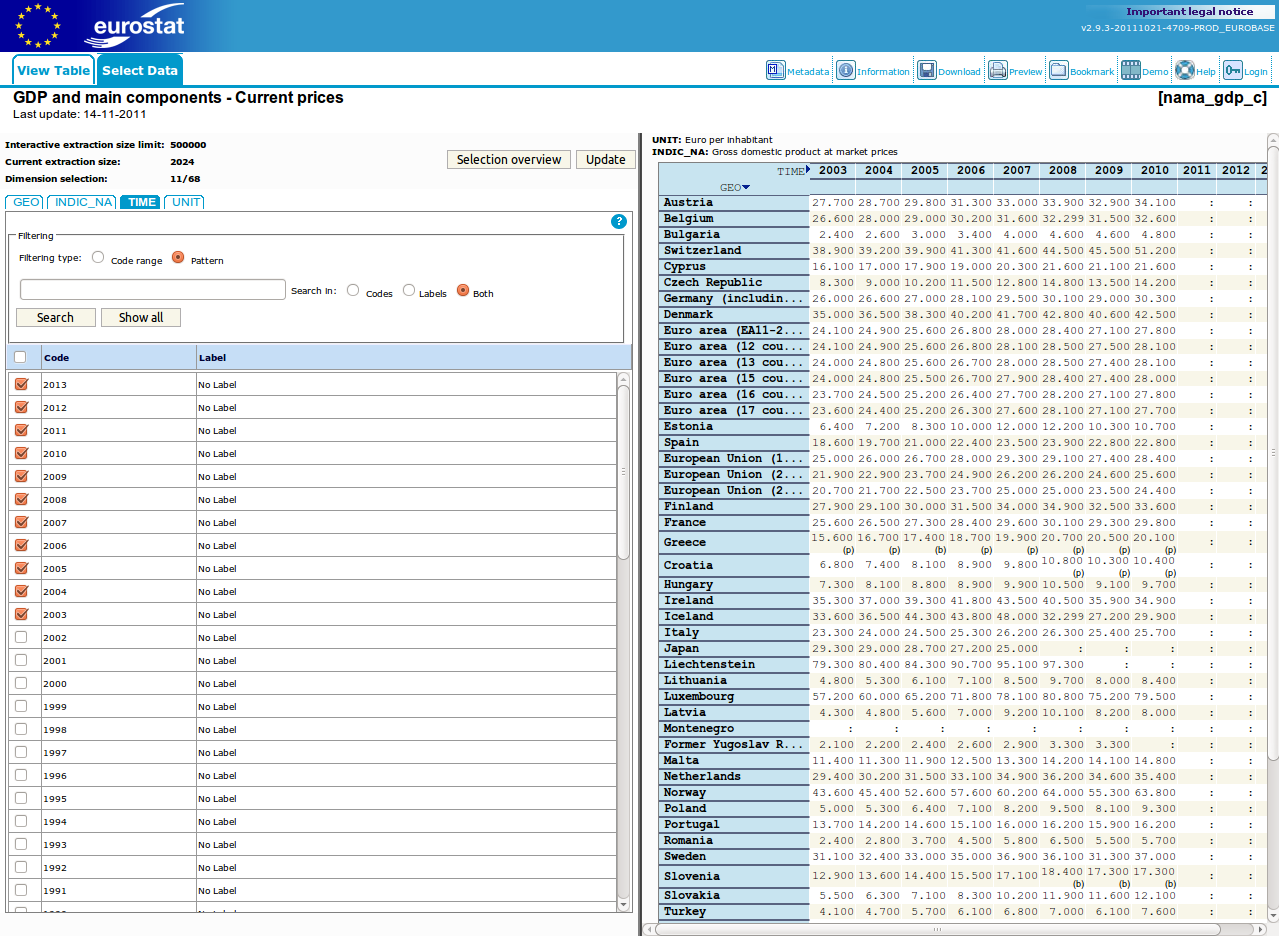
The full Eurostat database can be accessed through the statistics database.
This data can be accessed by various groupings:
After selection, the desired regions and years can be selected, viewed in a table and exported.
Supported export formats:
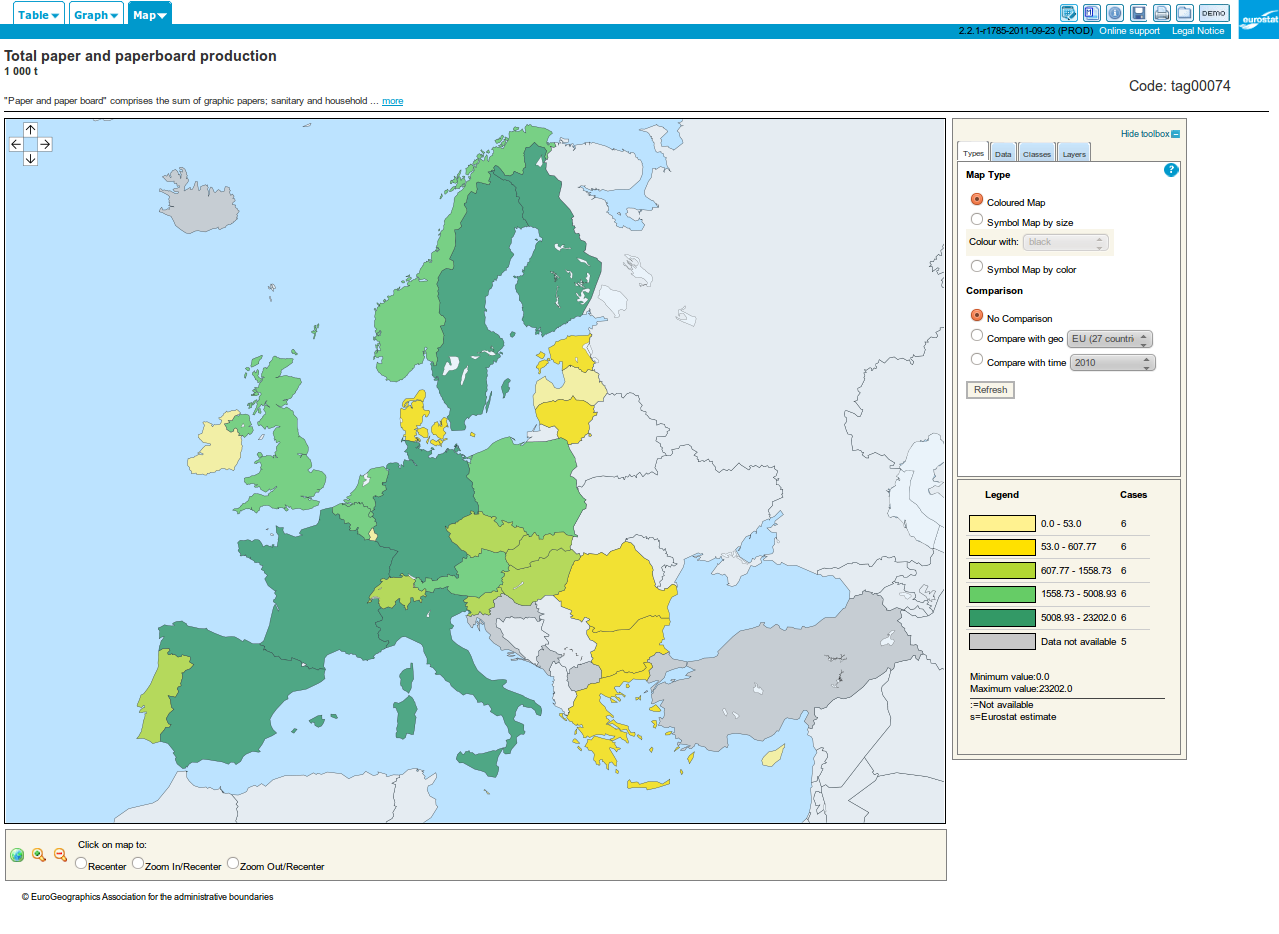
Predefined tables exist for the key indicators, where occasional users can find the data they are looking for. These tables are quickly viewable online with their graph and map variants.
This is an example of the paper and paperboard production main table graph.
Using the bulk download faility the user can download a lot of the data at once.
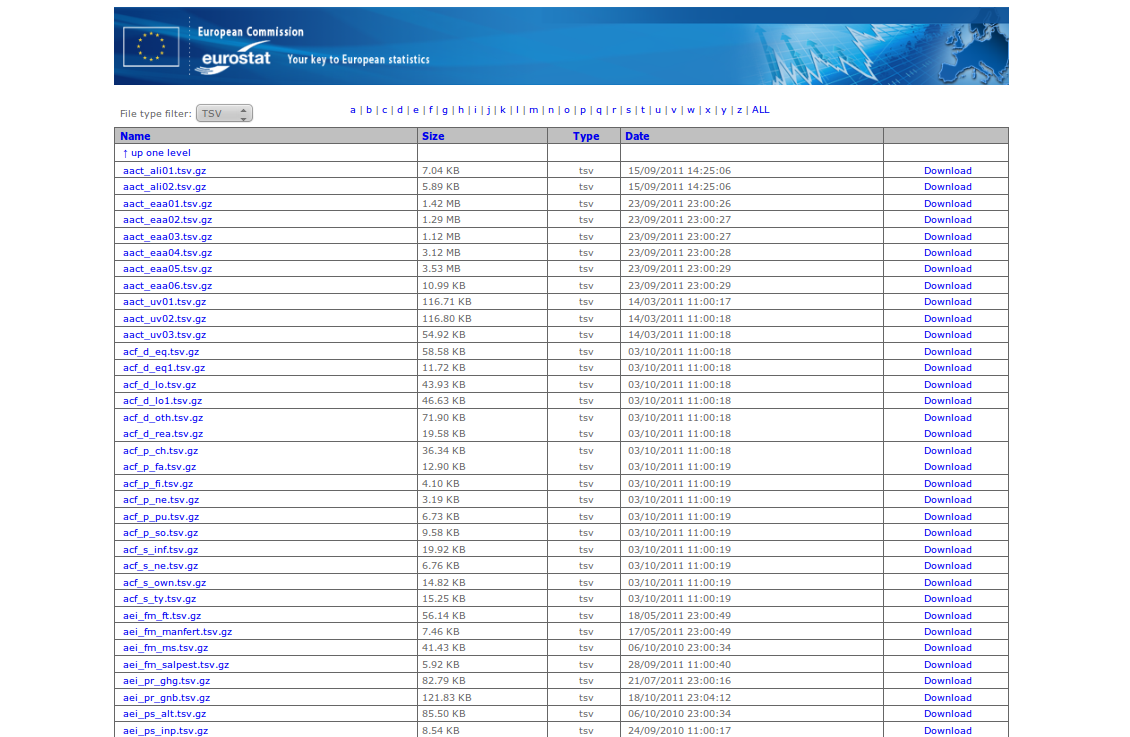
It can be exported to:
This tool's GUI is not very user friendly, as one has to browse some file hierarchy in search for the right data.
Access to certain anonymous interviews from surveys is available for scientific purposes. This data was used for some of the indicators calculated and offered in the main database. Topics include:
There exist several national and EU-wide RSS news channels that give daily digests of the relevant month-to-month statistical changes. A short message is displayed with the accompanying pdf document containing a more detailed description with graphs.
An example of such a feed can be seen here.
Geographic Information System of the European Comission offers various statistics presented on geographical maps, presented in pdf.
European Environment Agency has interactive maps and graphs on air, climate change, land use etc. Interactive maps require Microsoft Silverlight.
A nicely-formatted data collection on certain topics with descriptions, tables, graphs etc. An example topic is "Labour market statistics". Issued annually.
Statistical Data and Metadata eXchange (SDMX) - SDMX is an initiative to foster standards for the exchange of statistical information. A project sponsored by Eurostat, World Bank...
They specify the XML-based WADL, WSDL etc. descriptions of various statistical data.
Different tools for access are available.
Except where otherwise stated, downloading and reproduction of Eurostat data/documents for personal use or for further non-commercial or commercial dissemination are authorised provided appropriate acknowledgement is given to Eurostat as the source, and subject to the exceptions/conditions hereinafter specified.
Pros - The database contains sub-national data - for smaller regions, cities (e.g. production of cows' milk on farms by NUTS 2 regions).
Cons - There seems to be no API.
The indicators seem to be covered in the World Bank database as well. The World Bank has a similar (maybe a bit better) user interface, but includes an API, which makes it a preferable choice.