by: Drazen Lucanin (drazen.lucanin at gmail.com)
The World Bank is an international institution (187 member countries) that provides financial and technical assistance to developing countries.
It provides low-interest loans, interest-free credits and grants to developing countries for a wide array of purposes that include investments in education, health, public administration, infrastructure, financial and private sector development, agriculture and environmental and natural resource management.
Their main efforts comprise of:
You can find more information about the organisation and its actions on the World Bank website.
The World Bank collects a lot of statistical data concerning most of the countries to help guide invesment decisions and meassure and compare the results of the projects.
To make this data useful to others as well, it is available transparently through their open data web site.
Every year the World Bank produces:
The data set covers 209 countries spanning from 1960 to 2010.
The data is compiled from officially-recognized international sources, presents the most current and accurate global development data available.
The data is collected anually. There is usually a two-year lag between the present year and the most recent data reported to the World Bank (e.g. for the World Development Indicators and Global Development Finance publications).
The data can be browsed online on the World Bank open data website. It is organised in the following hierarchies: - by country - to examine the indicators for a specific country - by topic - collects all the indicators that are a part of some topic; the available topics include: agriculture, aid, economics, education, various demographics, ... - indicators - the 298 featured indicators or 1000+ indicators in the "all indicators" list can all be browsed online (e.g. Expenditure per student, primary (% of GDP per capita)) - data catalog - showcase of all the available data collections as they become available and the possibility of downloading individual ones (e.g. Socio-Economic Database for Latin America and the Caribbean) - microdata - information about specific characteristics of individual people or entities (households, business enterprises, facilities, farms or even villages or towns); may be obtained from statistical sample surveys and censuses, or as a by-product of an administrative process (e.g. Albania - Enterprise Survey 2007 )
Interactive maps with graphical representation of the numerical values is useful for human overview.
An interface to all the World Bank databases can be found here. Through it the user has access to all the indicators mentioned above plus the indicators from additional datasets - 7000+ indicators in total.
The user can customize the selection of indicators, countries, the time period, format the data represenation in rows, columns and sheets as he wishes and export it as CSV or Excel format to his computer.
The interface is very friendly and the output is customizable.
Most notably, the datasets can be examined and exported through the eAtlas online application covered in the Tools section.
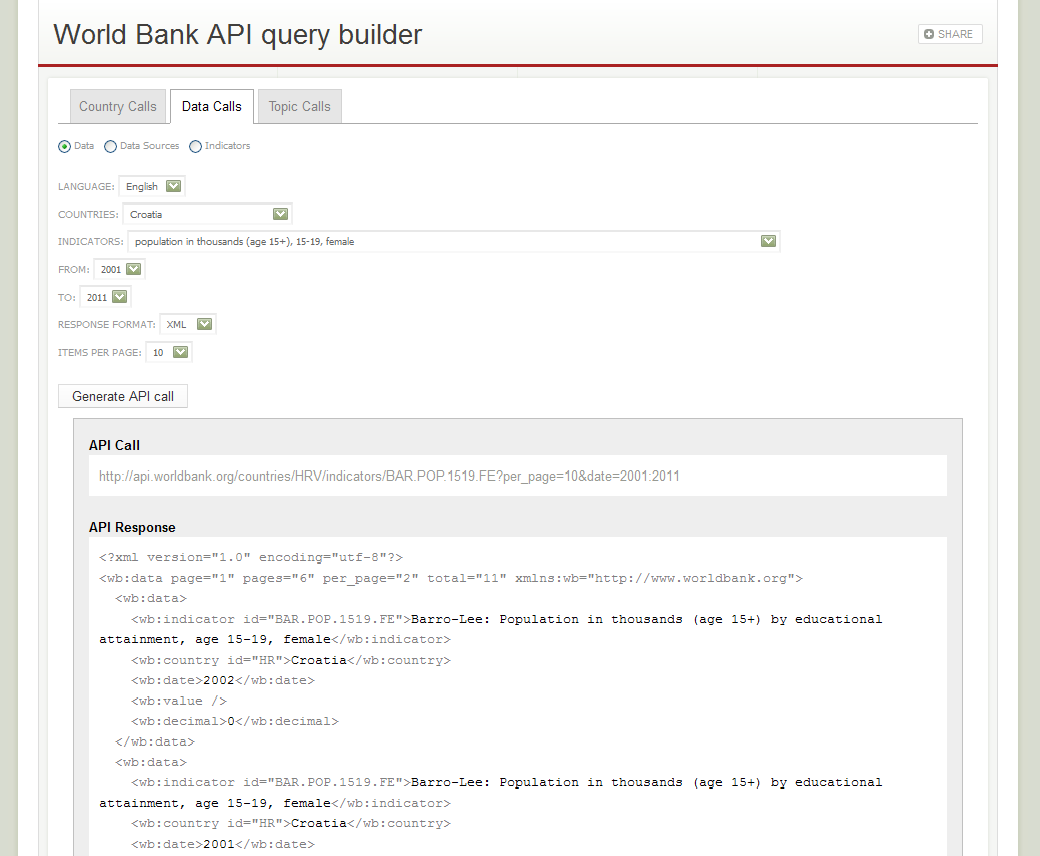
A very well written portal containing the documentation for programmers who want to access the World Bank datasets can be found here. The portal contains API documentation, example applications and a user-friendly query builder (to easily target to specific indicators with the application).
There currently exist three APIs, to access:
All of them are implemented as RESTful HTTP interfaces.
The API gives programmers access to more than 3000 indicators and query the data in several ways. API, XML and JSON represenations are available fore the indicators.
An example API query (built from the image above) can be seen by opening this link in a web browser. The output is XML showing values for the population in thousands by educational attainment, age 15-19, female. Note that the values are stated only for years 2005 to 2010, probably because these were the only years in which this indicator was measured (inside the queried interval).
Aside from the data itself, several tools are already offered for free on the site's website to allow people to grasp the information. It appears that several separate programs exist that concern specific types of data (such as WITS for trade, ADePT for economics), but that recently more and more data becomes available through the unified eAtlas web interface (for example, gender data eAtlas became available recently).
This section gives a short overview of each of these tools.
An Adobe Flash-based tool available online where the user selects indicators (more than 175 available), countries (over 200 countries monitored) and a year (1960-present mostly available) and the aplication generates an interactive map and graph illustrating this. Very useful for the visualisation and comparison of various countries' progress.

After registration (rigorous password required), the user can export the created maps in JPG or PNG formats and graphs to his computer in the following formats:
Licenses and Copyright - You are encouraged to use the eAtlas to benefit yourself and others in creative ways. You may bookmark and export the information contained in the eAtlas, and you may share that information with third parties. The Statistical Mapping Module and Software is proprietary, copyright Collins Bartholomew Ltd, all rights reserved.
ADePT was developed to automate and standardize the production of analytical reports. ADePT uses micro-level data from various types of surveys, such as Household Budget Surveys, Demographic and Health Surveys and Labor Force surveys to produce rich sets of tables and graphs for a particular area of economic research.
User inputs the micro-level data in SPSS or Stata formats and as output gets print-ready tables and graphs.
License - appears to be freeware (not verified).
The World Integrated Trade Solution (WITS) is a software developed by the World Bank and various International Organizations (e.g. UNCTAD, UNSD, ITC, WTO) that gives users access to major international trade, tariffs and non-tariff data compilations:
WITS is a data consultation and extraction software with simulation capabilities. It can be used online or offline through a desktop application. In both cases a registration is neccessary.
License - WITS is free software. However, access to databases themselves can be fee-charging or limited depending on your status. It appears that most of the currently available databases are free.
Online PHP application designed for the cataloguing and dissemination of survey, census or other microdata which complies to the DDI and Dublin Core metadata standards. It is meant to assist data producers to collect, organise and make available various data.
License - open source.
A tool for predicting poverty/inequality measurements at the community level based on small area income/expenditure survey data.
Similar to the eAtlas tool described above, only deployable on mobile devices (such as the Apple iPhone or iPad)
A mobile application for tracking World Bank's money flow - what are individual projects doing with the money, how much has been disbursed etc.
All in all the World Bank's open data seems to be really well organised and presented - both to the user and to the programmer. The API seems to be well documented and of good quality, which can be seen from the large amount of software tools that were built on top of it (eAtlas and the whole World Bank web page is using it). This seems to be a sound dataset from the technical point of view and the set of indicators is vast, which can be helpful in finding the ones to best forcast economic fluctuations.